Speaking the language of business intelligence with an Australian accent

Showing posts with label SSRS. Show all posts

Wednesday, October 21, 2009

Conditionally Hiding Axes for Trellis Displays

Over the last year MVP Tim Kent has put out a series of really useful posts showing how various data visualizations can be created using SSRS.

The latest post on Trellis displays got me thinking on how I could tweak a few of the settings in Tim’s very useful sample report just a bit more.

In order to show more sample data, I changed the top axis of Tim’s sample report to show sales Bike subcategories because as we all know AdventureWorks sells waaaay more bikes than anything else. Below is a shot of the original report after that change.

TimKentTrellis

I made a few more tweaks and changes and came up with the report below

Trellis

The main ink-saving tip is to conditionally hide / show labels on the X and Y axes based on the items at the top left and bottom left of the trellis. In this case it is Road Bikes and Northeast. All that is needed here is a small amount of extra MDX to ORDER and RANK members in both the Region and Subcategory sets to provide the right meta data required to perform the conditional hide / show. Here is the MDX for the report showing the ordering and ranking of the appropriate sets.

WITH
  SET [SalesOrderedSubcategories] AS
    Order
    (
      [Product].[Product Categories].[Category].[Bikes].Children
     ,[Measures].[Sales Amount]
     ,BDESC
    )
  SET [SalesOrderedRegions] AS
    Order
    (
      [Sales Territory].[Sales Territory].[Region].MEMBERS
     ,[Measures].[Sales Amount]
     ,BDESC
    )
  MEMBER [Measures].[SubcategoryRank] AS
    Rank
    (
      [Product].[Product Categories].CurrentMember
     ,[SalesOrderedSubcategories]
    )
  MEMBER [Measures].[RegionRank] AS
    Rank
    (
      [Sales Territory].[Sales Territory].CurrentMember
     ,[SalesOrderedRegions]
    )
SELECT
  {
    [Measures].[Sales Amount]
   ,[Measures].[SubcategoryRank]
   ,[Measures].[RegionRank]
  } ON COLUMNS
,(
    [SalesOrderedSubcategories]
   ,[SalesOrderedRegions]
   ,[Date].[Calendar Quarter of Year].[Calendar Quarter of Year].MEMBERS
  ) ON ROWS
FROM [Adventure Works];
Set the SORT property of each group to its respective GroupNameRank calculated member, this way we can be sure that in our example the top ranked Subcategory (Road Bikes) will be the left-most item and the lowest ranked Region (Southwest) will be the bottom-most item in the trellis.

Sorting 

The real trick here is to use an expression to conditionally hide / show the axis labels so that we only see the X-axis labels at the bottom of the trellis and Y-axis labels on the left side of the trellis.

AxisLabels

Y-axis uses an expression that only shows the axis for the MIN ranked member for Subcategory

=IIF(
    Fields!SubcategoryRank.Value = MIN(Fields!SubcategoryRank.Value, "Trellis")
    , false
    , true
)

and X-axis uses the MAX ranked member for Region

=IIF(
    Fields!RegionRank.Value = MAX(Fields!RegionRank.Value, "Trellis")
    , false
    , true
)

It also helps to check the Hide first and last labels along this axis for the Y-axis as the zero value tends the throw off the alignment with the other charts where the X-axis is hidden.

HideLablels

The sample .rdl file can be downloaded here.

Wednesday, December 3, 2008

Book Review: Applied Microsoft SQL Server 2008 Reporting Services

Full disclosure: the author supplied me with a free copy of this book.

AppliedReportingServices2008 Teo Lachev's been hard at it again, toiling to get yet another full-featured technical book out hot on the heels of the actual product RTM. When I read & reviewed his SSAS 2005 book a couple of years ago I remember being impressed not only at the amount of content in the book but also the depth of content so close to RTM. Those who are familiar with Teo's previous books will not be disappointed with his latest work - Applied Microsoft SQL Server 2008 Reporting Services.

By now I think it's fair to say that most people out there have at least some experience using Reporting Services since the initial release some years ago. If you've had experience with SSRS this book is an excellent reference on the product's new features, a reminder on the older (and updated) ones, and how to go about customizing and extending in a number of different ways. For the complete newbies this book is also a great place to begin and then take some advanced steps soon thereafter.

On average the split between the "this is how you use the product" and the advanced content in technical books seems to be about 80 : 20, sometimes more. Teo's books consistently tip that scale in favor of the advanced stuff, coming out to about 60 : 40, maybe more. There's still plenty of starting-from-scratch foundational content but there's also plenty advanced stuff to satisfy those hungry for a bit more. This is where those already experienced in SSRS will see a lot of value.

Like other Prologika books there are plenty of documented real-world stories & lessons learned to save you finding out the hard way. Each chapter contains plenty of references to pertinent white papers, blog posts and useful applications to assist in administration or development of solutions. Naturally there is a ton of downloadable sample source code too. There's even sample code for creating a Silverlight reporting UI.

Like the late Ken Henderson did in his brilliant Guru's Guide books Teo makes a noticeable effort not to simply repeat information that can be found in BOL. Isn't that what we all want from a technical book?

Worthy of a place on the MS BI geek bookshelf.

Monday, December 1, 2008

Microcharts Visualizations Supported in SSRS 2005

Kudos to the Microcharts team who have just released a product fully supporting sparklines, bullet graphs and more within SSRS 2005. If you're a fan of Stephen Few's work and are longing for more efficient and effective data visualization options in SSRS (yes, including Dundas) then you might want to have a serious look at this technology. Naturally I'm wondering when they're going to support SSRS 2008. I'm sure they're working on it.

Early last year I managed to get some sparklines into a BSM and PPS CTP2 scorecard using one of the earlier versions of Microcharts. Since that time BonaVista Systems (the makers of Microcharts) was acquired by XLCubed. The original Microcharts used custom fonts to render its objects and hence I was able embed the resultant "text" in a scorecard to display the sparklines. As a result of some architectural changes Microcharts now uses images to produce their visualizations hence our ability to use them in a scorecard is not possible. Nonetheless, this image-based architecture now enables quite a few other potential opportunities that I hope to explore (and blog about) in the near future.

As a side note, the MC lead developer / architect, Andreas Lipphardt, maintains a data visualization blog that is well worth a subscription.

UPDATE (2 Dec 2008): Andreas has confirmed that they are working on a SSRS 2008 version (see comments). Apparently there is quite of lot of rework that needs to be done because of changes made to custom report items in the new release.

Friday, February 16, 2007

Business Scorecard Manager – Extended Page Filter Functions

In a previous post I detailed how to utilise the BSM-generated Page Filter parsing code in order to hook SSRS report view parameters to the values in scorecard page filters. If you haven’t read the original post it may be worth having a look at it before reading on as the rest of this post assumes some familiarity with this technique. We do cover this process in step-by-step detail in the upcoming BSM book which recently has appeared on Amazon, so the day it becomes available is not far off now.

Something I experimented with while researching the book was the ability to easily access a bit more information from the PageFilter XML fragment than just scorecard page filter values. The well-formed XML fragment that is passed from the scorecard view to report views contains not only data about the page filters engaged on the scorecard but also contextual row and column slicer data not to mention objective, scorecard and KPI GUIDs. In order to be able to gain access to this data I made a few small adjustments to the functions and added a new one.

GetPageFilterData() – this was originally the GetPageFilter() function. I have extended it to accept second string parameter named “type”. The type parameter requires a value of “Page”, “Row” or “Column”. The string returned will be an array of the values and label pairs corresponding to the part of the scorecard that has been requested.

GetElementGUID() – this is a new one. Similar code to the GetPageFilterData() function in that it accepts an extra string parameter also named type. This parameter requires a value of either “Scorecard”, “Objective”, or “KPI”. It will return the GUID for the corresponding item in the PageFilter XML fragment. The GUIDs returned are not really of too much use in this context but I figured it would maybe come in handy at some point. Note that the KPI GUID is not the GUID which identifies the base KPI but instead the GUID of the Actual or Target instance within the scorecard view. I’m sure there is some more code that can be written by someone (anyone?) which will allow you to take this GUID and track it back to the KPI GUID that it is based on. If anyone has had any experience with this please let me know.

GetFormatSetting() – this one is unchanged from the original BSM-generated code and simply returns the nth item in the array of label and value pairs that is passed to it by the GetPageFilterData() function.

The GetPageFilterData() function is the main point of this post. If you have a scorecard with page filters, dimension members across the columns and/or the rows axis the ability to easily configure SSRS reports to use the value corresponding to the row/column intersection of a data cell (as well as the currently engaged page filter values) is very useful.

The image below shows a simple scorecard view that has 2 page filters as well as dimension members on both columns and rows. By enabling Cell Selection (Pass cell selection to report view) in the Toolbar Options of a scorecard view we allow the user to click on values in the data grid of the scorecard and hence make the details of where in the scorecard they have clicked available inside the PageFilter XML fragment.


The cell that has been clicked is highlighted in yellow. The SSRS report below the scorecard uses the extended page filter functions to parse out and use the page filter as well as the row and column slicer context of the clicked value. In the end we’re just passing parameters to the report’s MDX query to return the Reseller Sales Amount for CY 2004 in France for Accessories.

Note that there is a second page filter set on “All Products” but we’re returning “Accessories”. The example scorecard view incorporates the MDX dynamic row/column member functionality introduced into BSM in hotfix 3 (hotfix 4 is the latest, though), so selecting “All Products” in the page filter will display the children (Accessories, Bikes, Clothing etc.) of that selected member on the rows axis. I included this just to add a bit more dynamic functionality to the example. In the context of this SSRS report view the Product page filter value is irrelevant – we just need to get the “accessories” row member.

In order to expose precisely what is happening under the covers I have built a second report which does nothing other than break up the page filter XML fragment into its raw and formatted parts and display them. Although not displayed in the shot below, the report also shows the results of the KPI, Objective and Scorecard GUID values as well as the raw PageFilter XML fragment.


The files needed for all of this can be downloaded here. The zip file contains the following:

1. A BSM workspace file that contains definitions for the example KPI & scorecard, data source, indicator etc.
2. An SSRS solution containing the two reports: Extended PageFilter data.rdl and Dynamic Report Data.rdl
3. A text file containing the code for the extended page filter functions. The code is also embedded in both reports too but I figured it would be helpful to have it separate

Enjoy!

Friday, December 15, 2006

BIDS problems related to Office 2007

I have just installed Office 2007 RTM (love it!). Unfortunately the same problem that caused me to revert from the Office 2007 Beta 2 Technical Refresh back to Office 2003 a few months ago is still here. In my case the problem occurs when trying to view MDX in the Calculations tab of an SSAS project in BIDS. I get: Unexpected error occurred: 'Error in the application.' From my understanding there is a mismatch in the versions of some of the SSAS DLLs that causes this. There are several other scenarios in BIDS and SSMS where problems occur, they are documented in this KB article. Brian Welcker also blogged about the B2TR problem a while back with regards to SSRS Designer problems with the same root cause. Unfortunately the hotfix referenced in the aforementioned KB article is only available when you contact MS support directly (someone has to explain the logic behind this for me one day... I don't understand why I can't just download it).

I believe there is a fix for this coming in SQL 2005 SP2 but for those who cannot wait for RTM a viable alternative exists here from Mary Potapova in this post or similarly in Brian's post. The fix is, essentially, making sure the versions of the offending DLLs are the same in a couple of different directories - it worked for me. The usual warnings apply here when copying and pasting different versions of DLLs around the place.

UPDATE: Darren Gosbell blogged about this very problem (and the solution) back in mid Nov. For some reason I completely forgot that I had read his post on this. I'm getting old.

Friday, October 13, 2006

SSRS - New white papers

Tonnes of new SSRS white paper goodness courtesy of SSRS team members and various MSDN authors. Brian Welcker has all the appropriate links here.

Monday, October 9, 2006

BI Documenter update - SSRS now supported

A new version of BI Documenter (v 1.6.1) has just been released, and now supports documentation of SSRS along with SSIS and SSAS. Read more about the other improvements & enhancements in this new version on their blog.

Thursday, September 7, 2006

At last, a SQL 2005 BI documentation tool!

Since the SQL 2005 release last November we've been hard up to find any doco tools that support SSAS, SSIS & SSRS. There are plenty of RDBMS doco tools but not much (anything?) in the way of a SQL BI tool. Ever since Chris Webb made us aware of BI Documenter in June my colleagues at SDM and I have been working with the developers of this product as we really liked the direction they were headed. We hope that in providing heaps of feedback & ideas we can get a tool that does what we really want. The latest release is well on the way to what we are looking for and supports SSAS and SSIS along with the usual relational DB stuff. Check it out here.

They tell us that future plans for the product include SSRS, data lineage/dependency mapping capabilities and SSIS diagrams. As it stands they have lots of underutilised meta data and are continuing to look for useful things to do with it.

Does anyone know of any other SQL 2005 BI doco tools out there?

Monday, August 14, 2006

SSRS - "Select All" feature to return

A few months ago I blogged about the Disappearing Select All Parameter that happened after applying SP1. Seems that the SSRS team have done an about-face on this change of functionality. There will soon be a hotfix to change the behaviour back to the way it was. The feature will also be put back in the upcoming SP2 (which is due some time in 2007 I believe).

Brian Welker has all the details and the reasons why the decision was made originally and, more importantly, why it will be changed back in this post.

Tuesday, August 8, 2006

The old "displayed in thousands" requirement

Call me a hopeless geek but I really get a kick out of learning something that makes my life easier. Sometimes what I learn also annoys me because I realise that I've been doing things the hard(er) way up until that point.

I've been re-reading MDX Solutions 2nd Edition and found something I should have known about long ago. Format string settings in Excel, SSRS, SSAS are pretty much the same across the board. You know, defining #,#.00; (-#,#.00) and all that kind of stuff to make numbers appear the way users want. (There are lots of sites out there with more info on this, the first one I found with a quick Google was http://www.ozgrid.com/Excel/CustomFormats.htm)

A common requirement in financial reporting is to display larger figures in thousands. For example $101,230,142 would be displayed to the user as $101,230. In order to achieve this most of us calculate the actual and then somewhere in the process explicitly divide the result by 1000. Simple. Thanks to Appendix D in MDX Solutions I learned that I can format my "in thousands" figures by adding an appropriate number commas on the end of my format string. Even simpler.

e.g. 123,456,789

Apply a format of #,#, (note the extra comma at the end) the number is displayed as 123,457 (rounded up)
Apply a format of #,#,, (two commas this time) the number is displayed as 123

Each comma on the end of the format string, in essence, divides the number by another thousand. Annoyingly simple.

Thursday, July 27, 2006

BSM - Passing page filters to SSRS report views

I recently experienced a bit of pain while trying to get BSM scorecard page filters to pass their values to SSRS reports. Unfortunately, this behaviour is not possible in BSM without a bit of work. Nonetheless it can be done.

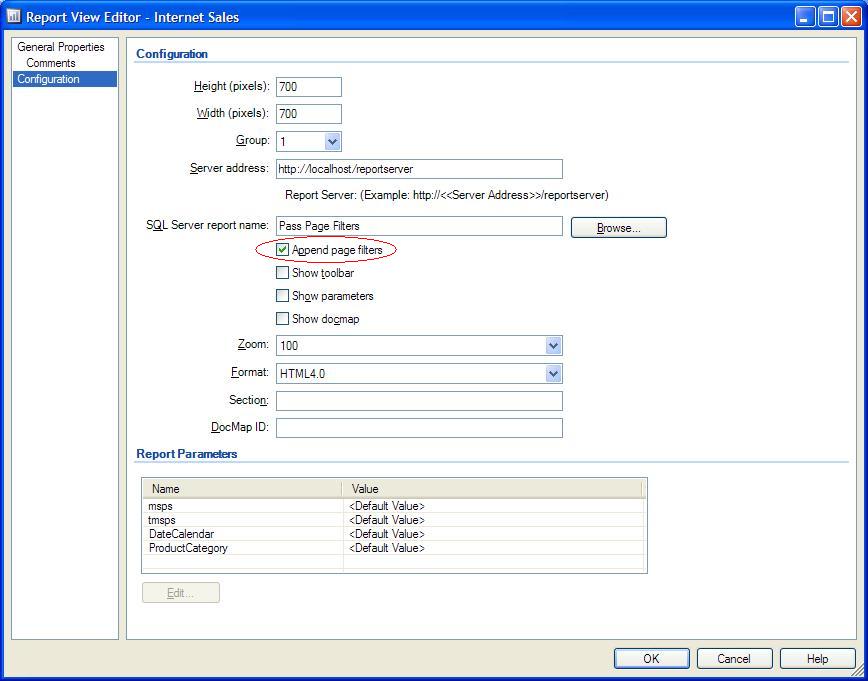
When setting up an SSRS report view you have the option to append page filters. You also get access to set default values for the parameters that a particular report exposes. However, if you have tried setting this up expecting BSM to seamlessly pass its page filter values over you will have found that, once published, the SSRS report view screams out for a parameter named msps and fails; something along the lines of "An attempt was made to set a report parameter 'msps' that is not defined in this report". OK, you think, I'll give you your lousy msps parameter. So you create a simple parameter with that name (you may also repeat the process for a tmsps parameter) and redeploy. Now the SSRS report view renders beautifully but will still not pick up the page filters that are being applied to the scorecard it sits next to.

It's unfortunate that the UI for hooking up SSRS reports kind of leads us to expect that we can hook the page filters to the report parameters without much work. The fact is that we can't achieve this without a little bit of code (which we don't have to write). As a result of the research I did for this post I now understand that the UI only goes part of the way to completely hooking the scorecards and their elements to SSRS reports. In the UI we get access to the parameters of the report itself but we don't have the ability to tell BSM which report parameters to bind to which page filters (or row/column slicers etc.). All we can do in this UI is, in essence, hard-code the report parameters, which doesn't help us achieve our aim.


All we're really doing when we check the append page filters box is ensure that the scorecard appends a well-formed XML fragment to the URL it sends to the report view. If the report does not know what to do with this XML, the fragment vanishes harmlessly into the ether and the report remains oblivious to the data once available to it. We need to embed code into the report to make proper use of the XML.

There is a post in the BSM newsgroup asking how to get around this issue. Some have worked around it by sending users via a custom .aspx page which contains similar code to what we will use in this example to parse out the appropriate bits from the well-formed XML fragment that BSM creates and then pass a homemade URL to the report in question. This approach certainly works but is an ugly solution as it potentially requires a custom-built, hard-coded .aspx page for each report. The solution I present here, while far from graceful & elegant, is at least a little easier to hook up and maintain across multiple reports. If you want more information on the XML fragment that contains not only PageFilter but also Column & Row slicer data and more I highly recommend reading the Business_Scorecard_Manager_Passing_Parameters_WP white paper found on this page.

How do we do it?

First we need to harvest some code. BSM designer gives us the ability to generate a scorecard report .RDL file by selecting Tools -> Deploy Scorecard -> To Reporting Services Report... Ensure you choose "Save SQL Server Report to the File System", all we want is an .RDL file, we don't need to deploy it. Open the RDL file in BIDS and have a look in the Code tab of the report properties. You will find code looks similar to that found in the white paper referenced above. This is the stuff we want. The two functions in this code take the XML fragment and turn it into something more useful. The GetPageFilters() function parses out the page filters and their display values into an array. The GetFormatSetting() function simply returns the nth item in that array. All we need to do is embed this code in our report that we want to hook up to our scorecard. Note that there are always two parameters present in the BSM-generated RDL: msps and tmsps. All we need to do is mimic the way these two parameters are used and use their output to populate the .Value property of our report parameters.

Here are the basic steps needed to ensure your report picks up page filters from a scorecard.

1. Create your SSRS report with parameters that line up with the page filters on your scorecard. You don't have to create parameters for all the page filters on the scorecard, just the ones that are relevant for your report.

2. Copy & paste the code from the Code tab of the BSM-generated report into the Code tab of your report. For a bit of reusability you could create an assembly using this code, register it in the GAC, and then reference that class in all subsequent reports. We're doing things the quick way here.

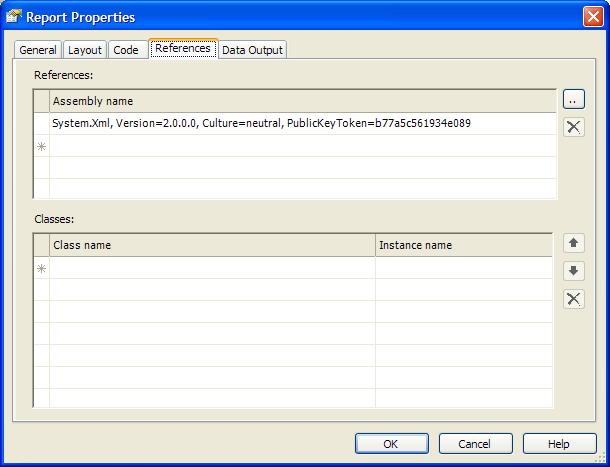
3. Still in the report properties of the new report ensure you make a reference to the System.XML assembly in the references tab (whether it's 2.0 or 1.1 will depend on what .NET framework version you're working with)


4. Create two parameters named msps and tmsps with the same settings as those in the BSM-generated RDL. Order the parameters so that msps is first and tmsps second.

5. GetPageFilters() returns an array made up of the Parameter.Value and Parameter.Label data we need to pass to our parameters. For example if we have a scorecard with 2 page filters the array returned will be in the form of:

(PageFilter1.Value,PageFilter1.Label,; PageFilter2.Value, PageFilter2.Label,;)

We then use the following code in the Default Values -> Non-Queried area of each parameter to get the item of the array we need. In this case we need either item 0 or item 2 in the array to get the two .Value elements. We wrap GetPageFilters() inside the GetFormatSetting() function.

=Replace(Code.GetFormatSetting(Code.GetPageFilters(Parameters!msps.Value), 0), ";", "")

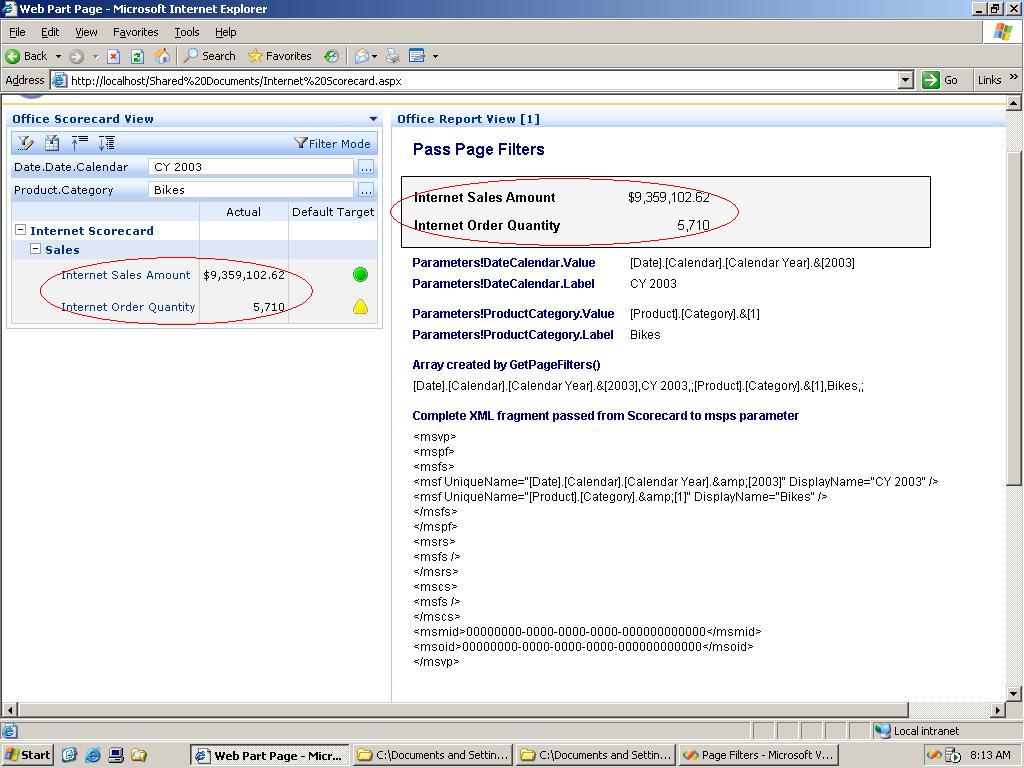
Some may notice the use of the Replace function to get rid of some unwanted semi-colons in the array returned by GetPageFilters(). There is plenty of opportunity here to tweak the code we get from BSM in order to avoid this and even extend it further to handle Column and Row slicer data. For the purposes of this post I have kept the code generated by BSM as I found it. The sample Pass Page Filters.rdl displays the various parts, both processed and unprocessed, of the BSM XML fragment, this serves to give a clearer picture of what data we're receiving and what we're doing with it.


The sample scorecard and associated report can be downloaded here. Inside the .zip is:

1. a BSM workspace with two KPIs and one scorecard (Internet Scorecard). The scorecard has one scorecard view. The SSRS report view is configured at the scorecard view level.

2. an SSRS solution containing two reports: a clean, BSM-generated, RDL file (Internet Scorecard.rdl) and a report that implements the page filter functionality detailed above (Pass Page Filters.rdl)

3. a .vb file (PageFilters.vb) with the necessary code which I simply cut & pasted from the Code tab in the Internet Scorecard.rdl report.

All you need to do is deploy the SSRS reports first and then publish the scorecard. Note that all has been set up using localhost so if you're working with any named instances you may need to reconfigure some of the data sources.

Hope this is of use to those out there who have been wanting to implement this kind of functionality.

UPDATE: For some more advanced use of this technique including functions that expose row & column member data see this post

Friday, June 30, 2006

SSRS - End user report builders.Worth it?

My recent unwanted comment spam has reminded me to materialise some thoughts that have been in the back of my mind for a while now.

It's been interesting to watch in recent years the attempts to come up with a good way for end users to build their own reports without the need for SQL skills or a Visual Studio license; a valiant quest but nonetheless a difficult one. Around the time of the initial RS2000 release several development shops raced to come up with a something that MS would (hopefully) buy and then incorporate into the Yukon product. The successful company was Active Views and their product eventually became what we now know as Report Builder. As far as I am aware Active Views' main pre-Yukon competition was Cizer.

The initial gripe many had with RS2000 was that we had to have a VS2003 license in order to design reports. This was because of RS' early completion date and MS' decision to get it to market prior to releasing Yukon, hence the need to retro-fit report development into VS2003. Enter Cizer and Active Views et al. A big part of the value proposition was "you don't need to buy Visual Studio 2003 to build reports! All you have to do is buy our product" ;) Now that the Visual Studio shell (for BIDS) is shipped with the SQL Server 2005 license some of the shine has come off this proposition (if it was indeed that shiny in the first place).

Now, don't get me wrong, I think the concept of users building their own reports is great, as long as the users actually build reports (and then use them). Maybe I have been working for the wrong clients but I've rarely (if ever) encountered a company that employs any/enough so-called power users with adequate skills and enthusiasm coupled with complete lack of SQL skills to justify the purchase of one of these apps to build simple reports. Either you're a geek or you're not, this is rarely much in between.

As report developers we have all seen endless demos of SSRS in both the 2000 and 2005 incantations, and possibly demos of varying flavours of end user report builders. All report demos are supposed to be simple and easy, we all know that - it's part of the sales process. Then we cross the reality gap as we walk back into the office. When did you last build a production SSRS report whose requirements were so simple it could be built in under 5 minutes using drag & drop only? When was the last SSRS report you built that did not contain even just a liiittle bit of complexity that the user just had to have? Not many right? I'm sure there may have been a few, but not many. Remember that the "little bit of complexity" may be something easy to a developer (say, a variable or some simple string manipulation) but to our power user it may be something they just can't (or don't want to) get their heads around. Default reaction: "Call IT!"

The power users who fit the non-SQL skilled, but tech-savvy enough to build useful reports are, IMHO, few and far between and rarely enough in number to justify buying another product on top of the original SQL Server license for writing simple reports. Remember, you get Report Builder included in said license, and it's a pretty good product (esp. when you consider the price). RB's use of a semantic data model which, if well designed and maintained, can be a useful reporting platform even for experienced developers. I know the other products have all sorts of funky bells & whistles that make for impressive demos, but in the end are they really going to get used properly? Like all of the other bundled SQL Server components, why not try to make use of Report Builder? It doesn't matter if you don't use it, you haven't paid anything extra for it. This is not to say "Report Builder is the best", it is one of several options, but it is easily the cheapest and most accessible. Regardless of what you think of RB - some love it others don't - it's certainly worth seeing how good your organisation's uptake of this kind of functionality is before shelling out $ for a piece of potential BI shelfware. Now, by shelfware I am not maligning the various products that are out there, just that BI products (no matter how good) are renowned for being quickly forgotten once the initial sales presentation hype has died down and business reality sets in.

Nonetheless I'm sure there must be some companies out there who are making good use of their end user driven report building tools. Who are they? Am I completely alone in my opinion here? Are the products actually being used to build reports or are they more useful for the report portal-type functionality many of them inherently provide?

Interested to hear what anyone thinks about this.

Saturday, April 29, 2006

SSRS - Disappearing "Select All" Parameter Post SP1

If you have deployed production SSRS reports with multi-valued parameters and applied SP1 you will need to alter the T-SQL code if you still want users to have the Select All option. SP1 removes what was only a piece of UI functionality in the RTM version. All that this feature did was give users the ability to check all of the boxes a parameter list with one click. Because of the checks in each parameter item box this could then result in a potentially large and inefficient IN clause. Multidimensional queries also suffered from the Select All feature. After SP1 the multi-select list will still exist but the Select All option will be gone.

To fix things you will need to alter both the parameter and main dataset/s T-SQL and implement the All functionality in much the same way we we used to do it in RS2000. Have a look at this page under Adding an All Member to a Multivalue Parameter (about half way down). The April 06 BOL update also has details on Breaking Changes in SQL Server 2005 Reporting Services.

The code change is simple and quick and as a result report queries for All will be more efficient. I can understand why this change was made in the service pack but just wish MS had added it to a more visible list or page when the pack was released so we don't have to figure things out after users call to tell us their report doesn't work the way they expect all of a sudden. All we really got was "the automated parameter-generation behavior has been improved".

UPDATE: The SSRS Team have decided to put this feature back in the upcoming SP2. Read more here

Thursday, March 30, 2006

SSRS - MDX Drillthrough gotcha

"Drillthrough" is an almost overused used term in BI. In SSRS it is often used when providing Jump To functionality to send the user to another report, a URL or a bookmark within the current report. We also have Infinite Clickthrough in Report Builder (Enterprise Edition only). The MDX DRILLTHROUGH statement also provides (surprise, surprise) granular drillthrough functionality and presents a small but easily-solved gotcha when using SSRS as opposed to using the same statement in RS2000.

The new SSAS functionality in SSRS both improved & changed the playing field quite a bit when it comes to accessing OLAP data for reports. In 2005 when we want to use the new SSAS interface to build queries (either hand-coded or drag & drop) we create a data source using the Microsoft SQL Server Analysis Services provider type which is ADOMD .NET. This is fine for the master report data but trying to execute an MDX SELECT DRILLTHROUGH query against the same data source will result in an error like this:

Failed to parse the query to detect if it is MDX or DMX. (MDXQueryGenerator)

For the drillthrough report and its query we now (unfortunately) need to create another data source, this time using the OLE DB provider for Analysis Services 9.0. When you create your new data source select OLE DB in the Type dropdown then select Microsoft OLE DB Provider for Analysis Services 9.0 in the OLE DB Provider dropdown.


Using this new data source we are now able to create a new dataset and run our drillthrough MDX query. Unfortunately we don't get to use the nice colour-coded UI and object browser, we're back to the old-style view.

An SSRS solution with an example of reports using DRILLTHROUGH can be found here.

UPDATE: As usual fellow Aussie blogger Darren Gosbell is right on top of things. He actually posted this as a bug to MS a while back. MS gave him a workaround which allows us to continue to use the original Data Source but must enter the MDX Drillthrough statement as if it was a DMX query - apparently this was by design. Oh well... Either way we now have a couple of methods on how to get past this problem, niether particularly elegant, but both work. Thanks to Darren for keeping me on my toes.

Wednesday, March 1, 2006

BSM & SSRS – KPI Meta Data Reporting

I figure everyone now refers to Business Scorecard Manager as BSM so I will too in my post titles...

A great post from MS SQL Technology Specialist Nick Ward's new blog which gives details on creating SSRS reports to expose KPI Meta Data.

Subscribed!

Saturday, January 7, 2006

Book Review - Microsoft SQL Server 2005 Reporting Services

The 2nd edition of Brian Larson's Microsoft SQL Server 2005 Reporting Services was released in November last year. This is, of course, a revision of the RS2000 edition of book with appropriate additions & changes to bring the content up to date with the current release of the product.

Overall the book is great for those with little or no Reporting Services experience. It covers all things SSRS from beginning to end: installation, report design, deployment, management & security etc. etc. It does go into a little more technical depth here and there but the book was never meant to be a deep dive into the innermost workings of the product. It assumes the reader has no Reporting Services experience and to this end includes quite a long chapter on database and T-SQL basics. There is also a very good chapter which goes into a lot of detail in explaining the various report rendering formats along with the pros and cons of each. Other RS books have skimmed over this topic, it was good to see an entire in-depth chapter dedicated to this.

A few months ago I put together a two-day training course in order to teach our team of consultants how to design reports in RS2000. One of the hardest things I found was putting together example report design exercises. I wish I'd had this book with me as a guide to formulating that part of the training. As you would expect in a Reporting Services book a good chunk of the content is aimed at actual report design. There are several large chapters filled with very detailed, well-organised, step-by-step instructions on a number of realistic report design scenarios covering all report objects and several advanced techniques. While I have not read the first edition of the book I could see some of the example exercises where the author has added a few extra steps to make use of a new SSRS feature like user-defined sorting or freezing table/matrix rows.

As Business Intelligence Development Studio (BIDS) is installed as part of the client tools component of SQL Server 2005 the group of people able to develop SSRS reports is becoming much larger. This is good news for the hard-core developers who may prefer spending less time building simple reports and more time taking care of the infrastructure which supports them. So how do you get new users up to speed on using SSRS? Hand them this book with a few strategically placed bookmarks: "Here, step through these examples and let me know if you have any questions." I know not everyone will appreciate being handed a 700-ish page book, but it is a good start and you may be surprised at how many could take to that style of learning.

Let's not forget about Report Builder. One of the appendices in the book covers the overall basics of Report Builder well and serves as a good start to a new user's experience with this excellent addition to the MS BI toolset. Brian does note that Report Builder will only be available with the Enterprise Edition of SQL 2005 which highlights how far in advance authors must have to complete their manuscripts before sending them to the publisher; around the middle of 2005 MS announced that Report Builder would be included in Standard and Enterprise Editions along with the Workgroup Edition (which is limited to report off local and relational sources only).

A few things that disappointed me about the book:

  • I would like to have seen more example exercises on the improved development experience when it comes to SSAS-based reports. There was at least one example of a report which sourced data from a UDM but it would have been nice to have more in this area including walkthroughs based on a data mining model, a report [Builder] model, a Web Service or even an XML file.
  • In the chapter dedicated to Report Manager I found it strange that there was no mention of the ability to manage one/many Reporting Services instance/s through SQL Server Management Studio (SSMS), instead all the focus is dedicated to the web-based Report Manger.
  • At the time of this writing the sample code is not available (or at least I can't find it) on the McGraw Hill / Osborne book site. The code from the original RS2000 edition is there but this is not very useful when it comes to examples involving newer features.

It's easy to see that Brian has been busy in the months leading up to the release of SQL Server 2005. Aside from the book reviewed here he has another book - Delivering Business Intelligence with Microsoft SQL Server 2005 - which has been / is just about to be released - I'm looking forward to reading that one too.

In comparison with Integration Services (SSIS) and Analysis Services (SSAS), Reporting Services is the BI tool that has changed the least in this current release of SQL Server 2005 (obviously, because it's only been in existence since Feb 2004 and was originally designed for the Yukon release). For this reason alone books about RS2000 are not going to differ vastly from those on SSRS. So if budgets are tight and you already have copies of other RS2000 books you may want to direct the money towards other upcoming SQL Server 2005 BI titles. On the other hand, if you have no books on Reporting Services at all this is a great one to start with.

In summary this is a good book to have around the office, not as much for the already experienced Reporting Services developer but instead to help beginners learn about the product from the ground up. If you're a trainer of any kind or someone charged with ensuring more people in your organisation develop SSRS skills then this is a book you should have.

Saturday, November 26, 2005

SSRS - MS open for suggestions on next version

Brian Welker has asked for feature suggestions for the next version of Reporting Services. So, if you've got something you want to see now is the time to make yourself heard by posting a comment on Brian's blog.

Monday, November 14, 2005

SSRS - best practice white papers

From Brian Welker's blog https://blogs.msdn.com/bwelcker/archive/2005/11/12/492225.aspx

Brian Welker et al have put together 3 white papers detailing best practices for several aspects of SSRS.

Here are the direct links to the white papers themselves:

Wednesday, November 9, 2005

Excel 12, SSRS - More intuitive dates

When a user wants to specify a date, a date range or even select a period relative to today their options have been a bit limited (from a pure MS perspective). Often is will be up to the report developer to design specific date functionality into what the end user will interact with.

One of the commonly-lamented shortcomings of RS2000 was that there was no date-picker available to wrap a date parameter. Sure, if you built your own custom front-end to RS this could be done but not with the out-of-the-box Report Manager. We all know that the date-picker functionality is now in SSRS, and a very welcome addition it is.

So, what about when our user is creating a report in Report Builder. They come across a date field. When developers build models for Report Builder a field with a datetime data type can be manipulated in number of ways and then grouped in the model. For example, the Order Date field; the user is presented with a range of different meta data options pertaining to that specific date field. When initially creating the model the model designer wizard automatically creates a number of different date derivatives when building the initial model (day, month, quarter, year etc.). However if your users have a specific need for a certain format of date meta data you can easily create these with the formula editor in model designer. The left-hand pane of the below image shows an example of pre-defined date derivative fields.


There are even more options available if the user wants to add some form of date filtering to their Report Builder report. The above screenshot shows the options a user is presented with when they choose to filter on a date field. Not a bad set of choices, and we don't have to code anything to give them that level of functionality, all we do is provide the date field.

So what about dates in Excel 12? A user's ability to sort and filter data in Excel 12 is going to take a major step up. So, if your user is working with data in an Excel table or PivotTable and would like to do some date-based analysis they will be presented with options like Next Year, Last Week, Yesterday etc (screenshot from Excel 12 Blog) Excel 12 will check the system clock and thereby determine what relative time period actually is.

These types of date manipulation options have certainly been available in various forms in different BI products for some time. This is nothing new or revolutionary from that perspective. However, it shows that MS is really concentrating on giving the BI end user much more power right off the mark without any (or at least a lot less) developer intervention. Great stuff!

Saturday, October 29, 2005

SSRS - Report Models as a data source in Designer

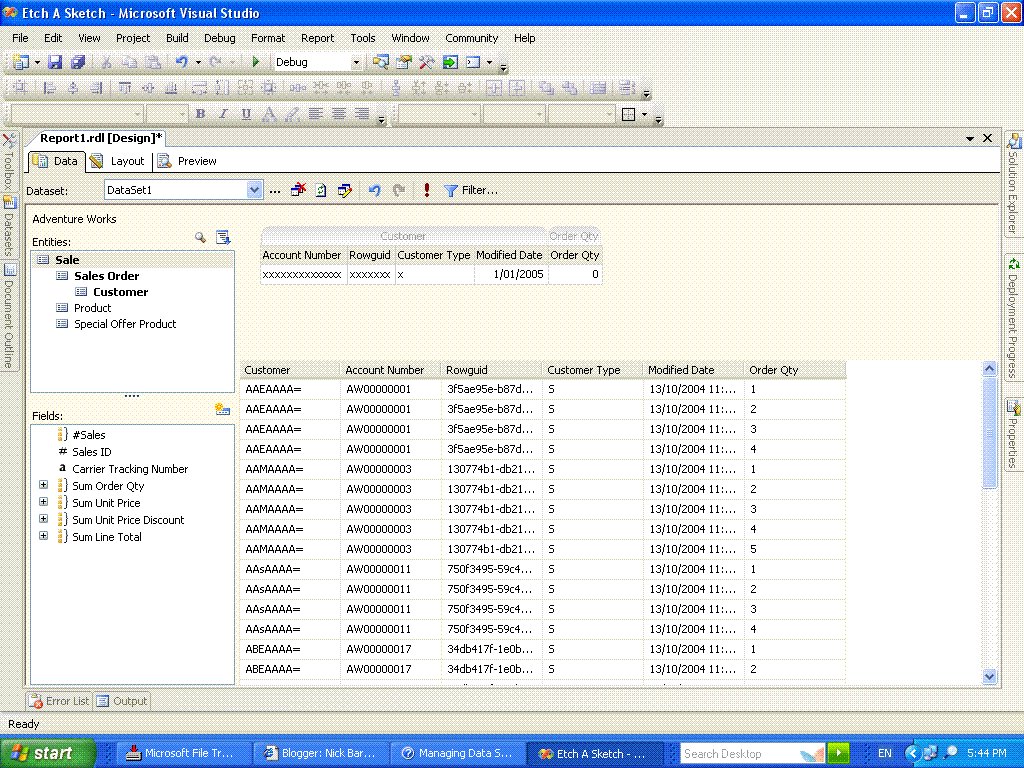
At a recent user group meeting in Sydney MS Evangelist Dave Lean reminded us that developers don't need to use the Report Builder app to create reports off report models. Just create a connection to the report model you have deployed (or generated) on the report server. In the data tab of designer you'll get a drag & drop interface which closely follows the RB experience (including the very intuitive filter functionality). So now, because we're working in Designer, we can build multiple result sets off the same model and include them on the one report just as we would with any other data source. Very cool.

Here's a post by Russel Christopher on how to create the model connection.