Business Scorecard Manager – What’s the Score?
I have been waiting for the day a client asks me how the score of a KPI is calculated. Deciding that I wanted to avoid resorting to the “dunno” response I started searching but couldn’t find much in the way of a formula or other decent explanation for this mysterious number. I posed this question on the BSM newsgroup in an attempt to find out more. When I got a response from "Neil I" I fired a quick email to BSM PM Ian Tien to see if he had anything further. He sent me some documentation from the original Business Scorecard Accelerator. I certainly cannot be considered a mathematician or statistician, so for those of you who are please excuse me if I use the incorrect terminology. Here we go…
What is the KPI Score?
From Original Business Scorecard Accelerator doco:
“In balanced and general scorecards, one or more KPI values are rolled up to determine the value of the objective to which they belong. Because KPIs can measure different kinds of data, which are often quantified differently (currency vs. integers, for example), Business Scorecards uses a calculation method to determine KPI values on an evenly distributed scale (also called a "score"). After the individual KPI values are placed in the context of the evenly distributed scale, a value for the objective is calculated. Similarly, objective values are used to determine the value of a perspective.”
NB The quote above refers to Objectives and Perspectives which were explicit containers in the original Scorecard Accelerator. BSM gives us more flexibility as to how we group our KPIs in each individual scorecard but the purpose of score remains pretty much the same.
Where do I find / display the score?
A score is always calculated for each individual KPI. You can make the score of a KPI visible in the Specify Actual and Targets dialog box when configuring a scorecard view.
If you choose not to explicitly display the score on the scorecard it will still be visible as a tooltip when hovering over the indicator of the KPI itself. Many people mistake this number for the figure which drives the indicator image – this is wrong.
The comparison of actual to target (depending on the banding method used) is the value which determines the colour/shape etc. of the indicator but the score does not have any effect on what KPI icon is displayed at the leaf level of a scorecard. Score does have an effect on the displayed indicator as soon as we begin to roll the leaf-level KPIs up.
How do we get an evenly distributed score?
If you do not normalize to a linear range according to consistent thresholds, you can’t roll up KPI values. In order to make the scores evenly distributed there needs to be something consistent underlying all score calculations.
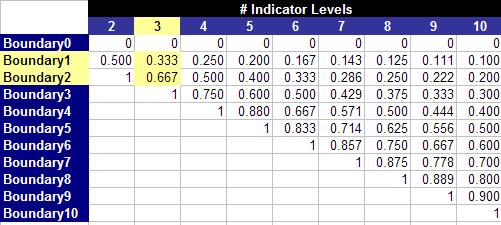
BSM finds out in between which of the KPI target’s user-defined target Boundaries the (Actual or Normalised) value lies. Once it knows that the value falls between BoundaryX and BoundaryY it then determines what the linear range upper and lower thresholds to use in the calculation by determining what the values for BoundaryX and BoundaryY are for an n-level indicator. BSM uses a formula along the lines of
(1 / # of Indicator levels) * Boundary number
For example, my KPI target uses a 3-level indicator and my value (11) falls between the target Boundary1 (3) and Boundary2 (15) values I defined. Now that I know this I can use the table below to establish that the BSM score calculation will use
(1 / 3) * 1 = 0.333
and
(1 / 3) * 2 = 0.667
So what’s the formula?
Example 1
Your KPI target is based on a 3-level indicator, using Band by Numeric Value of Actual and Increasing is Better. You set the target Boundary1 = 5 and Boundary2 = 10. Your actual value is 7. Because the actual value (7) falls between your defined Boundary1 (5) and Boundary2 (10) the score will use linear threshold values of 0.333 and 0.667 for its calculations i.e. Boundary1 & Boundary2 for 3-level indicators.
The score would be calculated thus:
(7 - 5) / (10 - 5) * (0.667 - 0.333) + 0.333 = 0.467 (46.7%)
(Actual - Target Lower Threshold) / (Target Upper Threshold - Target Lower Threshold)
*
(Linear Upper Threshold - Linear Lower Threshold) + Linear Lower Threshold
Example 2
Your KPI target is based on a 5-level indicator, using Banded by Normalized Value and Decreasing is Better. You set the target Boundary2 at 25% and Boundary3 at 50%.
Your actual is 260 and your target is 200. Remember that you also have a Worst Value to adjust if need be. You set this to 400. These numbers result in a normalized value of 0.3 (30%) the calculation being:
1 – ((260 – 400) / (200 - 400)) = 0.3 (30%)
1 – ((Distance from Actual to Worst) / (Distance from Target to Worst))
OK, so 30% sits between your defined Boundary2 (25%) and Boundary3 (50%) therefore the linear thresholds for these for a 5-level indicator will be 0.4 and 0.6 (refer to reference table used earlier)
So to work out the score:
(0.3 - 0.25) / (0.5 – 0.25) * ((1 - 0.6) - (1 - 0.4)) + (1 - 0.4) = 0.56 (56%)
NB because we are using Decreasing is Better we have (1 – threshold value) for each of the internal boundaries in the second half of the formula.
The Rollup
So as a result of the two examples above your rollup score would be calculated
(0.467 + 0.56) / 2 = 0.5135 (51.3%) 
So now, if and when a client asks me how KPI the score is calculated I can tell them. Now all I have to do is wait to be asked…
UPDATE (11 Feb 07): A few slight technical adjustments


73 comments:
This blog entry has been deemed "looks awesome but is far too much for my pea-sized brain to read on a Saturday afternoon". Keep it up Nick.
Great post Nick! Now there's a good link we can point people to who ask in the newsgroup.
Thanks Neil I, much appreciated! Couldn't have written it without your help.
nice work...
This is excellent analysis, but I'm still confused about how to display the value driving the icon. Anyone know the answer to this?
You can configure each scorecard view to display a number of different figures including actual, target and score. Have a look under the "Where do I find / display the score?" heading in the post.
The colour / shape etc. of the KPI indicator is determined only by the relationship of the actual value to whatever target & thresholds you have defined. I know that the percentage which appears when you hover over each indicator is a little misleading.
Hi Nick,
Great article, just what I have been looking for. I understand how you arrived at the 51.3% overall figure, but I don't know how to actually create a scorecard that reflect that - do you know of any resources that can show me that?
Hi, I have setup BSM and everything seems to working fine in that I can see the KPI's and indicators in the scorecard webpart. One issue is that I am unable to see the rolled up values at the objective level. I have followed all the instructions and all threshold and banding settings are exactly the same for all targets.
Any ideas
Thanks
Gary
Thoms & Gary,
You need to check the "Show Roll-up" checkbox in the Specify Actuals and Targets dialogue box.
HTH,
Nick
hi,
i just want to how to explain to the client the perception of the score ? what does it represent ? For example having a score of 42% and being slightly off target : how do i interpret my score ?
Thanks folks
I am still having troubles see the correct indicator representation. I am using three level (Red, yellow, green) and only one KPI for testing. I think my SQL statement may be the issue. All data renders correctly to my Sharepoint Portal but the indicator value is not correct. It shows green at 100% where it should show Red.
I am using SQL and the column names and values for the only KPI are as follows:
Projects: AD_Upgrade
Previous: 10%
ToDate: 25%
Target: 100%
Trend: 25%
My SQL statement from Trend is where the indicator comes from and although the portal shows it as 25%, the indicator shows 100% and Green. Here is the SQL statement:
Select Trend, 0 as dummy from projlist where project='AD_Upgrade'
Can anyone help with this?
Thank you!
Hi John,
From what I can see you are comparing your ToDate value of 25% to the Trend value which is also 25%, hence 100% score and green.
Remember, for each KPI there is only one Actual (displayed as the grey icon). All others are targets (the green icons). The targets cannot be compared to each other in order to display a visual indicator. Whenever you enable an indicator on a target element of a KPI it will *always* compare its value to that of the Actual.
Cheers,
Nick
Thank you very much Nick, that does clear things up a bit. Your blog is awesome!
No problem, John. Thanks for the feedback, it means a lot!
Hi Nick, is it possible to filter the views of a scorecard based on the user. So, Manager1 sees only KPI's that he is responsible for and Manager2 etc ...
Thanks
Gary
Hi Nick, regarding my question about filtering who can view the KPI's I meant from a client perspective in the browser. Not inside the builder. eg When Manager1 opens a browser and sees the Scorecard Webpart view, he needs to only be able to view the progress on the KPI's that he is responsible for. Other managers wouldn't want everyone to see how they are doing. Can BSM filter based on user or would I have to set up multiple scorecards that were customized per user and use SPS audiencing.
Thaks
Gary
Gary,
You configure permissions for who can view what in the BSM Builder, you then deploy what you have built to the scorecard server. These permissions (if set up correctly) allow differing levels of access to scorecard views, reports, KPIs etc. through the browser.
Again I would encourage you to look at the security training video at http://office.microsoft.com/en-us/assistance/HA100621081033.aspx
Nick
The calculation of the scores on objective level, I understand...but where do you define the thresholds for the indicators on objective level. Does it take the thresholds over from the first measure underneath? This actually is not correct...
Thanks!
An excellent question Joos and one that I have been wondering myself ever since writing this post. I just haven't had the time to research it. When I do find the answer I will post it. Stay tuned.
Thanks so much for this post. For the longest time, I was wondering how the score is calculated and I could not figure it out.
...and thank you for letting me know that this helped you. Much appreciated. NB
Hallo Everyone,
my name is Christian and I read this block and all its entries.
First of all, thank you very much for this information. But I cannot really understand why there is only this kind of measure that can be applied to KPIs displayed on a scorecard.
The reason: I would like to customize the given intervals, e.g. the stop light (using 3 intervals), to fit my purposes in that way that I put in there 0%-70%-90%-100%. The problem with this is that I still want to see for 800 of 1000 a score for the KPI of 80% and not the "plausible" but strange measurement given.
Is this somehow possible?
Hi,
I have the fallowing problem with thresholds under a Target of one of KPI's.
I have 'Actual' hoe present "previous" and "current" values, the data coming
from SSAS.
And 'Target-(change)' present a SSAS calculations value, the data coming
from SSAS.
Am trying under 'target-(change)' to Add Thresholds. I want when the
Calculations value under the 50% must giving red colur and green when it is
above 50%.
The problem is when the Calculations value is under or above the 50%, it
just giving a Green colur in the scharepoint portal.
My Indicator have two colurs red and green, de Banding settings as fallow:
Patten: increasing is Better
Band by: Normalized value of Actual/Target
How can help with this problem or can tell my how to get my goal but maybe
in different way.
For you information I tried to do the calculations in MDX tuple formula
under Data Mappings I getting the right value but now I getting just the red
colur
Thx you ..
Manhal10
Hi Manhal,
Sounds like you're close to finding the problem. My suggestion is that you use a spreadsheet or even a piece of paper to check the calculations your banding settings use. By this I mean: have a good, close look at the diagram in the banding settings pane. This picture details precisely what calculations BSM is making in the background to drive the indicator. Plug the numbers you have for Actual, Target & Worst value into the formula and you will likely find the issue. I too have had the same problem where I could not work out why the indicator icon was the wrong colour. Going through this quick, simple exercise helped find the cause.
Cheers,
Nick
Hi Christian,
Sounds like you're not after the score at all. The score (as detailed in the post) is NOT the result of the Actual to Target comparison that you are looking for, it is something quite different. Scores are calculated so that unrelated KPIs can be meaningfully compared with one another. You are looking for a value specific to individual KPIs, forget about score for the moment.
To get the figure you're looking for, create a new Target within your KPI (remember targets do not have to be "targets" per se, they can simply be a place to make a calculation and display the answer to the user). In the newly created Target define an MDX formula along the lines of [Measures].[Actual] / [Measures].[Budget]. Format the number as a percentage and you will have your 80%. All you need to do is ensure the new Target is configured to display in any Scorecard View it is contained in.
HTH,
Nick
Nick-
Great discriptions and very helpful.
I am setting up a BSM scorecard to use a data cube that has cube roles built in to restrict certain users to certain levels in a dimension. How do I get the sharepoint site to pass through the user's information to access the cube? By default it uses an account name I cannot find documented. I have also seen the blog talking about setting the BPM.ConnectionPerUser key in the config file but that seems to have no effect.
Thanks and keep up the good work-
Cuy
Hi Cuy,
Thanks for the positive feedback. Have you had a look into whether Kerberos authentiction has been enabled? If your SPS and SSAS instances are on different boxes you may be experiencing encountering a double-hop issue.
Cheers,
Nick
Nick-
I am back again working on the same problem. Have switched to using MOSS '07 and Analysis Services '05, all are on the same Development box, and still the scorecard displayed in SharePoint is the same for all users. Have double checked the web.config file for both the MOSS extended site and the BSM server and everything looks like it should make a Connection Per User. Is there something else I have missed? Or am I looking at the wrong setting to inforce the cube's roles?
Thanks again-
Cuy
Hi Cuy,
Sounds like you're on the right track. I would try tracing the SSAS server and see "who" is making the query to the scorecard data source. Because you have enabled PerUserConnections you *should* see that query being made by the user. Start there and see how you go.
Cheers,
Nick
Hi nick,
I wanted to know how does bsm calculate score in case "closer to target" is selected.
-ameya
Hi Nick-
Thanks for the suggestion. Have run a trace on SSAS and the cube queries are being run by the individual users according to the trace log. But if it is in fact using the specific user's credentials to query, I do not see why it would not use the roles defined within that cube.
Thanks-
Cuy
Trace:
Query Begin, MDX Query, NTUSERNAME = "Cuy";
...
Query Begin, MDX Query, NTUSERNAME = "Admin";
...
Hi Cuy,
As long as the person querying the cube is a member of that role then the role security should apply to them.
Cheers,
Nick
Hi Ameya,
"Closer to Target" uses the same formula. My best advice is to create a KPI with static values and create an Excel spreadsheet which incorporates the formula and check your results against what BSM displays.
Cheers,
Nick
Hi Nick,
I have 2 questions...
(1)
I am getting SOAP Exception while using the method 'GenerateViewFromConfiguredView()' on a certain machine for any scorecard. All other methods work properly. Does BSM require some specific configuration/settings of its prerequisites like anlysis server etc?
(2)
If I add dimentionality but dont add page filters, (or add just one), does bsm assume 'All' level for unspecified dimentions while calculating scores?
Hi Ameya,
1. There are no specific setting that I am aware of. What are you trying to do here?
2. The score calculation does not directly use any dimension or page filter settings when it is calculated. The numbers within the KPIs themselves will (natually) be affected any dimensional page filters. From a scorecard perspective, though, a dimension (or attribute in 2005) that is not included will default to its "all" level, unless a specific default member has otherwise been specified in the UDM. Note also that KPI Actual and Target-based filters may also be affecting the numbers that KPI contains.
HTH,
Nick
Thanks nick. I am trying to use BSM webservice in my client application. Method which is not working (GenerateViewFromConfiguredView)
returns viewdata which is used by my application. method works on other machines but on a particular machine it fails. I am passing scorecard guid, view guid all right but for pagefilters/row memberfilters/columnmemberfilters I pass 'null'. I get bpmexception 'unknown error'.
Hi Ameya,
The first thing I would do is find out why you're passing in NULL values.
I must admit that I haven't done much work with the BSM API so am not sure how much help I can be.
Cheers,
Nick
Hi Nick. Great article!
just wondering: if I specify a scorecard with Kpi's and under the kpi's specify a dimension (e.g a company dimension) how do I rollup the actuals and goals to a kpi?
Any thoughts?
Jan
Hi Jan,
Thanks for the feedback. How do you mean rollup actuals & targets? Remember that scorecards are not there to aggregate these numbers. Is that what you're trying to do here. What is your aim?
HTH,
Nick
Hi Nick.
Maybee a visual on the subject can explain my goal.
Let's say I have a Kpi named ebitda; actual is 1000 and goal is 2000.
Like this
Actual Target
Financial
ebitda 1000 2000
Then I specify a dimension under the ebitda Kpi, like Company:
Actual Target
Financial
+ ebitda 1000 2000
companyA 500 1000
companyB 500 1000
But when doing this the actual and target for revenue is "gone", like this:
Actual Target
Financial
+ revenue
companyA 500 1000
companyB 500 1000
What I'm trying to do is "rollup" the companyA and companyB to the Kpi ebitda like the second example, but this is not working. Maybee I'm missing something here, and this is not possible in Moss2007?
Jan
Hi Nick,
I wanted to know about the user permissions of BSM. Which users' credentials should I insert in the permissions block of server administration tab of the builder?
Should I be admin on machine having bsm server ? I got this error while using builder:
"You do not have Administrator privileges on the Scorecard Server 'http://BSM SERVER MACHINE:46786/'. Contact your Scorecard Server Administrator."
Also why are there two settings to connect builder with server, one from workspace properties and one from server administration ?
Must BSM webserver work with windows authentication alone?
Ameya, what are you doing in Builder when you get this error?
Jan, you're trying to use BSM for the wrong thing. Scorecards are not really for aggregating numbers like you're trying to do for those P&L-type figures. Have a look at this post for some more thoughts on this.
The kind of calculations you're trying to do should probably be done within your cube. Normally GL account hierarchy aggregations are handled using unary operators in conjunction with a parent child hierarchy.
HTH,
Nick
Hi again Nick.
Thanks for the reply.
I'm aware that I'm using Bsm the wrong way here, only trying to figure out if it could be done that way. The only option I see, is defining a custom mdx-query including the ALL level to aggregate the companys..
Jan
hi nick, about the score issue, if i changed the boundries for a kpi from the default (the linear values) to another. For ex.:
indicator 4 levels, so boundries are at 0%, 25%, 50%, 75%, 100% for the kpi, if my target is 120, worst value is 0 and actual is 12, so score equals 10%.
But if i changed the boundries to 0%, 30%, 40%, 60%, 100%, for the same values the score will be 8.3%,
this is what is done, my Q, is this normal? so now i can't change the boundries so to have a right score value,so the rollup will b right on the objective?
sorry for long Q.
thanks
Tika, the behaviour you are seeing is precisely what is supposed to happen with regards to the numbers you gave.
Reread the post. The score is *not* the result of the actual to target comparison calculation. The fact that your actual (12) and target value (120) end up with a "Normalized value of Actual/Target" of 10% is just a coincidence and just so happens to line with the score for that KPI when displayed in a scorecard. Changing the threshold boundaries is supposed to change the score as you saw. Try calculating the score manually for both scenarios using the formula detailed in the post.
Cheers,
Nick
Hi Nick,
I am Robbin.
Here are a couple of questions about BSM Programming.
1) Is it possible to publish the KPI or Scorecard by updating the value in SerializedXML column either in table KPIs or table Scorecards in database ScorecardServer programmatically?
It seems that this method has never been mentioned by anybody. Is this idea too crazy? :-)
2) If the answer to 1st question is Yes, is it mean that I can control the BSM by altering the database other than by BSM Web service?
Thanks in advance!
Hi Robbin. In answer to your questions:
1) Yes, use the API.
2) I think if you alter the values in the SerializedXML columns correctly there would not be a problem. Remember though that these fields have no validation on them if you are simply changing their values through T-SQL. Your best bet is to use the API - that's what it is there for. Modifiying SerializedXML values manually is certainly *not* a recommended practice.
Cheers,
NB
Nick, you are right. API are definitely our best choice. Do you have any logic relationship diagram of the BSM objects? I think they are a little complex. If possible, could you please send a copy to my v-wenli@microsoft.com.
Thanks :-)
- Robbin
I have a question. Does BSM support automatically deploy/publish the KPIs and Scorecards onto a server without opening the BSM builder and the workspace?
Thanks,
Duga
This is somoething you could accomplish using the API.
NB
Nick, thanks for your prompt feedback. If my understanding is correct, I should write a program with the APIs to define(add) the KPIs, Indicators, Data sources and Scorecard? I guess we will cause trouble for ourselves if we don't use the BSM Builder
Builder certainly makes life a lot easier. I must admit that I have not done much with the API at all.
cheers,
NB
I was taking a look to the post and is very interesting. I have a doubt, how do you define the color for the objective level? I have looked everywhere but there is no way to control the color range for the objective. Is there a way to do this?
frr,
There is an Objective background & text color configuration that can be made as part of the scorecard view definition. They are found in the Row Header section of the Scorecard View Editor.
HTH,
Nick
Hi Nick, thanks for answering, as far as I know, that configuration option only allows you to control the text and background color but not the image color (the indicator image) or am I wrong?
FRR
Aaah, I see what you mean, FRR. OK, the image, background colour and text that is displayed in an objective indicator is driven by the calculated score which is rolled up from the items below it in the scorecard hierarchy. You can't control this manually. Naturally this is by design - the whole point of objectives is to roll up the KPI values that sit beneath them - they drive the indicator.
HTH,
Nick
Hi Nick, I know that I should not be asking this because the range color is the correct one, but is there a way to change the color range for a parent level in another way? (non manually)
Federico RR
Hi FRR,
No you cannot change the banding settings that are used in an objective. BSM uses the indicator images from the KPI that is located directly beneath it. It does not use the threshold settings of that KPI. Instead it uses the linear banding settings as per the grid in this post. For example if the nearest KPI to the objective is a 3 level one then the indicator image displayed will depend on where the rolled up score falls in reference to the 0, 0.33, 0.66, 1 boundaries (as per the table).
HTH,
Nick
PS Banding settings on Objectives and objective-specific indicators will be possible with PerformancePoint :)
OK Nick, thanks for the information.
Regards
FRR
Is there any way to hide ( not show) the score when user hover over to the indicator IMG.
Thanks
Anil
Hi Anil,
Unfortunately in BSM you cannot hide this. In PerformancePoint we will have more control.
Cheers,
Nick
Thanks Nick
Do we have option of showing exact percent rather than score in Performance Point Server.
By the way your blog is very help full.
Anil
Hi Anil,
Yes that percentage will be available in PerformancePoint. It is called the Raw Score.
Cheers,
Nick
Hi everyone
Thanks for this blog entry, it helped me understand some aspects quite well!
But one question keeps popping up in my head: for a "decreasing is better" KPI-definition (e.g.), what do the percentages for "best" and "worst" values mean?
I would think that "worst" = 120% means, if the actual value is 120% the target, it can't get any worse. So the value for "worst" I need to calculate the difference from actual to worst would be 1.2 * target. However this does not seem to be the case. At least not in PPS CTP4 which I am using.
You mention you "set the worst value" to 400 in your example and "worst" shows 110% on your screenshot. What is the connection between 110% and 400 in your example, if there is any?
If there is none (which I fear is the case) how do I set the "worst" value then?
I think I am poking the wrong hole somewhere (can one say that?), any help would greatly be appreciated.
Rgds
andreas
Thank you Nick.
Ameya, could you solve your permission problem? I have the same I have not any idea how to solve!
I found in the Scorecard documentation the following possible error:
"The Scorecard Manager Web Service AppPool account may not have permission on the server to run the Web Service"
But I am working in a local machine, and all is done with an Administrator user...
Thanks
Fede
I'm using a KPI to calculate the average of the "% Complete" column in a Task List. I've set the Goal to 90 and the Warning to 50. When I view the KPI it shows the correct average for the "% Complete" column, but shows the Goal as 9000 and the Warning as 5000.
Any ideas?
I've an interesting one, and must be being thick as can't figure it out. I have a decreasing is better metric and need to do something very simple. However because I have to supply a fixed value for worst, I can see a way of doing it.
Target is 50. i want to band so that 0-50 is green, 0-50+10% (ie. 55 is amber) and the rest red. However, because of the way the % is effectively the difference between worst and target - I can see no way of doing this. The target is variable pulled from the cube, so I can't set worst as a fixed value.
Any ideas?
its a nice blog.
Hi.
I read a same topic 2 month ago. The topic helps me to improve my competency.
Apart from that, below article also is the same meaning
key performance indicators examples
Tks again and nice keep posting
Rgs
Your article is so informative and I have cleared all of my doubts. Your way of explanation is awesome, thank you for sharing useful information..............................Get More details about Oracle Fusion Financials Training Details.
Post a Comment