SSRS - Dynamic Data Bars
A great visualisation feature of Excel 12 is data bars. In one of his first posts Bob Meyers (who is a Principal Developer for Report Builder) provides steps on how to create in-line data bars in Reporting Services reports. This got me thinking as to whether I could create a report with data bars that mimic the functionality we will get in Excel 12. The answer is almost. I got the data bars and the value they represent to render in on top of each other in BIDS when designing the report.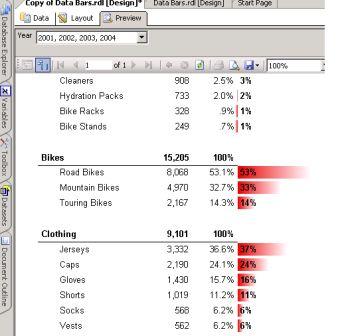
However, when the report is deployed to the ReportServer the layered textbox holding the value and the image are separated out.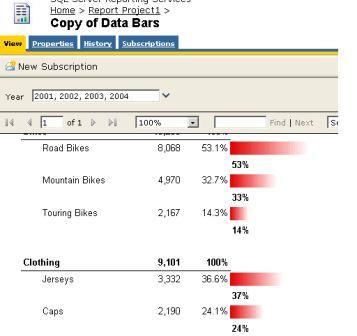
Nonetheless Bob's idea to create a few gradient images, embed them in textboxes and set the right & left padding accordingly works really well. If you create a few different coloured images you can then call each of them dynamically to get some conditional formatting going too.
The two tricks to getting the bars to render relative to each other is to provide:
1. a number which holds the width of the textbox in which the image is embedded. In the example I have embedded this value in a textbox named tbxWidth which I then reference in the function calls. Unfortunately I haven't found a way of reading the width property of a particular text box through a native report function. I'm sure there would be a way to read this property by writing a .NET assembly. Has anyone done this? In any case the width of a textbox in a report stays pretty-much static so you can easily put the value in a text box and hide it.
2. the maximum value for the group of values returned for the report. In the example I have embedded this value in a textbox named tbxMax which I then reference in the function calls. The tbxMax value is set to 1 in the example because the report uses percentages. Of course the max value can be (better) configured in a number of ways and not hard-coded in a textbox as I have done in the example. One way would be to use an in-line formula to return the max value within a specific scope of a data region. As always, it all depends on the report.
I've found that the data bars export well to PDF but do not survive an Excel export. You can download the sample RDL here.
Cheers,
Nick


1 comment:
If you find a way of reading the textbox width just let me know :) I am searching for this long time. Regards PirrA (djpirra at gmail dot com)
Post a Comment